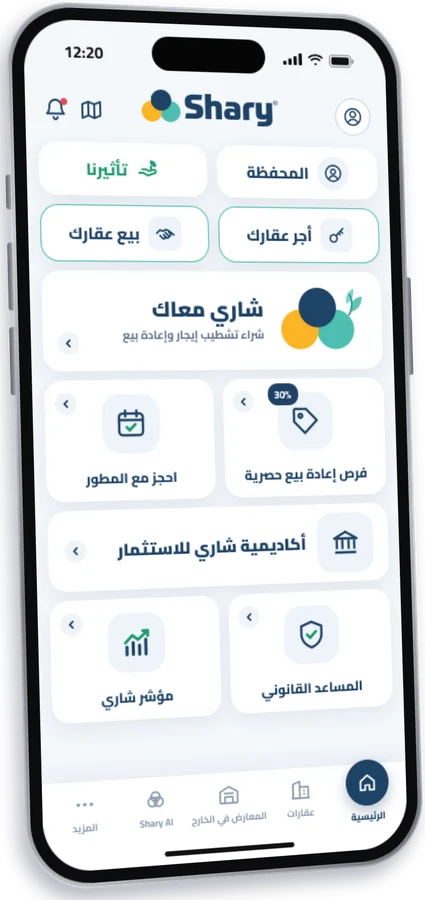
Shary AI
Tell us your budget and Shary AI will shortlist for you
Type the amount and the area to get the units that fit you.
Average price per m² and demand in El Tagamo3 el Awl by unit type — compared with the rest of Egypt.
Index filter Pick a unit type and an area — every figure follows
Area
Unit type
The figures below are for: Residential in El Tagamo3 el Awl
No Residential units are listed in El Tagamo3 el Awl right now.
The area index is a score out of 100 built from 4 factors for the market average in the selected area and unit type.
Where do these numbers come from? From the area's page in the dashboard («Prices and index»): each type's monthly price and the factor scores; if not written: from the published units' prices in the area and its projects' average index — the same figures as the area card on its page.
Type the amount to see the areas you can buy in · Residential
Be the first to know
Join the Shary channel to get new projects, market news and Shary Index updates as they happen.
Tap an area to open its page and projects · Residential
| # | Area | Price per m² (from – to) | Yearly | Rental yield | Resale vs. developer | Demand | Units |
|---|---|---|---|---|---|---|---|
| 1 | El Tagamo3 el Awl New Cairo | — | — | — | — | 75 | 0 |
| 2 | Sidi Heneish North Coast | — | — | — | — | 82 | 0 |
| 3 | Ras El Hekma North Coast | — | — | — | — | 92 | 0 |
| 4 | Hurghada Red Sea High price | — | — | — | — | — | 0 |
| 5 | New Cairo Opportunity | 40K – 165K | +15.0% | 4.1% | −40.7% | 88 | 1,798 |
| 6 | El Sheikh Zayed City | 90K – 137K | +15.0% | — | −50.5% | 88 | 383 |
| 7 | Sidi Abdel Rahman North Coast | — | — | — | — | 87 | 0 |
| 8 | North Coast | — | — | — | — | 66 | 0 |
| 9 | El Gouna Red Sea | — | — | — | — | 96 | 0 |
| 10 | New Capital New Cairo | 42K – 105K | +14.0% | — | −39.0% | 75 | 624 |
| 11 | Mostakbal City New Cairo Stable | 66.3K – 90K | +16.0% | — | −42.1% | 82 | 173 |
| 12 | 6 October City | 39.9K – 151K | +15.0% | — | −56.1% | 85 | 349 |
| 13 | Soma Bay Red Sea | — | — | — | — | 88 | 0 |
| 14 | Ain Sokhna | — | — | — | — | 80 | 0 |
| 15 | Fifth Settlement New Cairo | 45K – 165K | +15.0% | 3.8% | −49.4% | 90 | 518 |
| 16 | El Shorouk City New Cairo | 35K – 110K | +13.0% | — | −54.3% | 78 | 52 |
| 17 | New Alamein City North Coast | — | — | — | — | 60 | 0 |
| 18 | Al Rehab New Cairo | — | — | — | — | 90 | 0 |
| 19 | Sixth Settlement New Cairo | 63K – 118K | +6.0% | — | +1.4% | 85 | 80 |
| 20 | Obour city New Cairo | 20K – 85K | +12.0% | — | — | 76 | 10 |
| 21 | Hadayek Al Asimah New Cairo | 24,064 | +12.0% | — | — | — | 1 |
| 22 | Badr city New Cairo | — | — | — | — | 62 | 0 |
| 23 | Madinaty New Cairo | 66 | +15.0% | — | — | 94 | 1 |
No area matches this name.
Shary AI
Type the amount and the area to get the units that fit you.
Ad
Developer offers on the newest projects.
Ad
The Shary Index is updated every month.

Estimates to help you compare — not a promised return · Residential
Area
This is an estimate: installments without interest, the same growth and rent every year, and no maintenance costs or taxes. Review the numbers with a Shary advisor before deciding.
Pick two areas to see the difference in price, growth and demand · Residential
First area
Second area
Compare by unit type
Figures that affect the price per meter and the buying decision — with the change over the last year
53.74 EGP
Effect on property: A stronger dollar lifts building costs and unit prices — property keeps the value of your money.
Source: cbe.org.eg Updated: Sunday 22 November 2026 · 9:00 AM5,509.26 EGP
Effect on property: Gold and property both store value — when gold rises, buyers turn to property to protect their money.
Source: golden-circle.net Updated: Sunday 22 November 2026 · 9:00 AM43,050 EGP
Effect on property: Steel is one of the biggest building costs — when it rises, new launches price higher.
Source: ezzsteel.com Updated: Sunday 22 November 2026 · 9:00 AM4,065 EGP
Effect on property: Cement drives construction and finishing costs, which show in off-plan prices.
Source: alamarmasr.com Updated: Sunday 22 November 2026 · 9:00 AM9,200 EGP
Effect on property: Bricks are part of the building cost — when they rise, units and finishing cost more.
Source: alamarmasr.com Updated: Friday 13 November 2026 · 9:02 AM2,500 EGP
Effect on property: Cement bricks have replaced red bricks in most new projects — their price feeds building and wall costs.
Source: alamarmasr.com Updated: Sunday 22 November 2026 · 9:01 AM20%
Effect on property: High rates keep money in banks — when they fall, demand for property rises.
Source: cbe.org.eg Updated: Sunday 22 November 2026 · 9:01 AM12.7%
Effect on property: Inflation eats into cash — property is one of the best ways to protect it.
Source: tradingeconomics.com Updated: Sunday 22 November 2026 · 9:01 AM51,458.04 points
Effect on property: The stock market competes for investment money — big moves shift money to or from property.
Source: mubasher.info Updated: Sunday 22 November 2026 · 9:01 AMLatest launches, price increases, deliveries and decisions
Decisions
The Central Bank of Egypt has cut interest rates for the first time in over four years by 225 basis points, leading to expectations of a boost in…
Decisions
Egypt aims to issue a new law regulating the real estate market within a month. Housing, Utilities and Urban Communities Minister Randa El-Menshawy…
New launches
The New Urban Communities Authority has opened registration for the investment opportunities on offer for November 2026 through its foreign…
 NU
New launches
Al Marasem Developments has announced the launch of its new project, Al Marasem Ras El Hekma Village, located at kilometer 200 on the…
.jpg.jpg?v=9) AM
New launches
Zed West introduces a unique collection of upscale residential units, designed to offer a lifestyle filled with comfort, luxury, and top-class…
New launches
Madaar Development announces the launch of Island 3 in the Azha Sokhna project. The project offers luxury residential units with flexible payment options.
 MD
Developers ranked by the Shary Index: prices, growth and on-time delivery
| # | Developer | Shary Index | Yearly | Price per m² (from – to) | On-time delivery | Projects |
|---|---|---|---|---|---|---|
| 1 |
 RP
Redcon |
94 | +8.0% | 241K – 260K | — | 1 |
| 2 |
 LS
Landmark Sabbour |
92 | +15.7% | 16.5K – 629K | — | 6 |
| 3 |
 RD
Rayn |
89 | +14.9% | 175K – 478K | — | 1 |
| 4 |
 SD
Sodic |
86 | +11.6% | 87.9K – 869K | — | 24 |
| 5 |
 MV
Mountain View |
85 | +15.0% | 63.6K – 430K | 80% | 24 |
| 6 |
 OD
Ora |
84 | +18.1% | 107K – 238K | — | 5 |
| 7 |
 HP
Hyde Park |
83 | +19.9% | 70.8K – 505K | — | 7 |
| 8 |
 PH
Palm Hills |
82 | +18.5% | 70.1K – 699K | — | 37 |
Index for
The area index is a score out of 100 built from 4 factors for the market average in the selected area and unit type.
The project index is a score out of 100 from 5 equally weighted factors — every unit inside a project uses its project's calculation.
The developer index is a score out of 100 from 8 factors that measure the developer's record across all projects.
Free consultation
A Shary advisor helps you compare projects, prices and payment plans at no cost.